Abstract
Plastic pollution has pervaded almost every facet of the biosphere, yet we lack an understanding of consumption risk by marine species at the global scale. To address this, we compile data from research documenting plastic debris ingestion by marine fish, totaling 171,774 individuals of 555 species. Overall, 386 marine fish species have ingested plastic debris including 210 species of commercial importance. However, 148 species studied had no records of plastic consumption, suggesting that while this evolutionary trap is widespread, it is not yet universal. Across all studies that accounted for microplastics, the incidence rate of plastic ingested by fish was 26%. Over the last decade this incidence has doubled, increasing by 2.4 ± 0.4% per year. This is driven both by increasing detection of smaller sized particles as a result of improved methodologies, as well as an increase in fish consuming plastic. Further, we investigated the role of geographic, ecological, and behavioral factors in the ingestion of plastic across species. These analyses revealed that the abundance of plastic in surface waters was positively correlated to plastic ingestion. Demersal species are more likely to ingest plastic in shallow waters; in contrast, pelagic species were most likely to consume plastic below the mixed layer. Mobile predatory species had the highest likelihood to ingest plastic; similarly, we found a positive relationship between trophic level and plastic ingestion. We also find evidence that surface ingestion‐deep sea egestion of microplastics by mesopelagic myctophids is likely a key mechanism for the export of microplastics from the surface ocean to the seafloor, a sink for marine debris. These results elucidate the role of ecology and biogeography underlying plastic ingestion by marine fish and point toward species and regions in urgent need of study.
1 INTRODUCTION
Plastic debris, including microplastics and microfibers, is ubiquitous in marine environments (Bergmann et al., 2017; Cózar et al., 2014, 2017; GESAMP, 2016). While the sources and sinks of marine plastics are well studied (Jambeck et al., 2015; van Sebille et al., 2015), their flux and fate in marine food webs have remained elusive. Ingestion by marine organisms is likely a major pathway for plastic through the ecosystem (Galloway et al., 2017; Schuyler et al., 2014; Wilcox et al., 2015). Plastic ingestion by marine fish was first reported less than 50 years ago (Carpenter et al., 1972), and has been a topic of increasing research interest over the last decade (Figure S1). Following intensifying public pressure, the Joint Group of Experts on the Scientific Aspects of Marine Environmental Protection (GESAMP) reviewed plastic ingestion by marine fish in 2016 and identified 89 species that ingest plastic (GESAMP, 2016). Reviews published in 2019 saw these numbers triple, indicating that research interest, and possibly the scope and intensity of the problem, is mounting (Azevedo‐Santos et al., 2019; Markic et al., 2019). However, as studies have become increasingly common, so too have methods of detection improved (Provencher et al., 2019, 2020). Numerous recent studies have described issues with lack of standardization of these methods across studies, and have suggested guidelines to harmonize data collection and reporting (Cowger et al., 2020; Dehaut et al., 2019; Hermsen et al., 2018; Provencher et al., 2017, 2020).
Several recent studies have reviewed the available data on fish (Azevedo‐Santos et al., 2019; Lusher et al., 2017; Markic et al., 2019). While these references summarize the available data, they do not provide synthetic analyses to understand drivers of plastic ingestion by marine fish. Here we test whether (1) the incidence of plastic ingestion in marine species was positively correlated to surface microplastic abundance in Longhurst oceanographic provinces (Longhurst, 2007); (2) there was a difference among plastic ingestion in estuarine, coastal, or oceanic regions; and (3) there were phylogenetic, ecological, or behavioral determinants that influenced the rate of plastic ingestion in marine fish.
Marine and estuarine fish provide economic well‐being and nutritional security to billions of people (Food & Agriculture Organization, 2018; Hicks et al., 2019). A major concern, however, is that at least 100 fish species destined for human consumption ingest plastic debris (Markic et al., 2019). Still, the effects of ingested plastic on wild fish are largely unknown. Correlative evidence from field studies suggests that plastic debris can contaminate fish tissues with persistent organic pollutants (Gassel et al., 2013; Rochman et al., 2013), but whether this has deleterious consequences on behavior, physiology, fitness, or food webs via bioaccumulation remains chronically understudied (Bucci et al., 2020). Controlled laboratory experiments have confirmed that plastic‐derived compounds can transfer from plastic to fish leading to reduced activity rates, compromised liver function, and brain damage (Mattsson et al., 2015, 2017; Rochman et al., 2014; Wardrop et al., 2016); however, laboratory studies often use concentrations of microplastics that are an order (or several orders) of magnitude greater than average environmental concentrations (Lenz et al., 2016; Paul‐Pont et al., 2018). Doing so limits the ability to extrapolate results to non‐laboratory populations. Furthermore, there is burgeoning concern that plastic—or plastic‐derived contaminants—bioaccumulates in humans as the result of seafood consumption, although there remains no conclusive evidence (Barboza et al., 2018; Carbery et al., 2018; Lusher et al., 2017). To assess the potential effects of ingested plastic on fish, ecosystem, and human health, it is imperative to expand beyond reviews of existing data to understand the geographic and phylogenetic distribution of the available data, identify which species are at the greatest risk, and determine biotic and abiotic factors associated with plastic ingestion.
To address this, we amassed and analyzed a global database to address the following questions: (1) How prevalent is plastic ingestion among marine fishes, and does this vary geographically or phylogenetically? (2) What ecological and behavioral traits correlate with plastic ingestion? (3) Is there evidence of plastic bioaccumulation among trophic levels? (4) Has the scope and severity of the problem changed over time, and if so, is this a function of increased detectability by researchers or increased plastic consumption by fish? Ultimately, answers to these questions will inform conservation, identify critical knowledge gaps in urgent need of research, elucidate plastic flux through the marine environment, and support mitigation of this emerging threat.
2 METHODS
2.1 Literature review
We used Web of Science and Google Scholar to search for peer‐reviewed studies and agency reports published from 1960 through 2019, as the first scientific observation of plastic ingestion by wildlife was reported in the late 1960s (Kenyon & Kridler, 1969). We used the search terms “fish,” “plastic,” and “ingestion” found anywhere in the publication. We retained publications that reported original plastic ingestion data (at minimum, plastic frequency of occurrence [FO] for each species sampled) and any referenced publications. We excluded studies of fish in freshwater ecosystems; only marine and estuarine studies were included. We did not include studies of larval fish in this analysis due to their considerable differences in diet, behavior, and ecology from juvenile and adult individuals of their species. All studies published prior to 2016 were cross‐referenced with summary data compiled in the 2016 report to the United Nations Environment Assembly on the sources, fate, and effects of microplastics in the marine environment (GESAMP, 2016), the premier reference on this topic. For that small portion of studies where the original reference could not be found, we used the information in GESAMP, 2016 table AIII.2. Through these methods, we located 129 studies published from 1972 to 2019. To obtain the most representative and standardized data on plastic ingestion, we also collected information on which studies recorded microplastic ingestion, in addition to meso‐ and macroplastic ingestion. This latter subset included 110 publications from 1972 to 2019.
2.2 Data collection, aggregation, and delineation
The response variable for our analyses and visualizations was FO of plastic ingestion (i.e., plastic FO; number ingesting plastic debris/total number studied) for each species within each study as species‐specific plastic FO was reported for every study, which was not the case for other metrics of ingestion (e.g., number of items ingested per individual). This follows established methods for current meta‐analyses of plastic ingestion (Savoca et al., 2016; Wilcox et al., 2015). Where possible, we also calculated the mean number of plastic items consumed by each species in each study by multiplying the average number of particles ingested per individual by the number of individuals that had ingested plastic and dividing that total by the sample size.
In addition to FO of plastic ingestion for each species and average quantity of plastic ingested per individual, our analysis also included the year(s) the data were collected, the year of publication, and the oceanographic province(s) where the samples were collected (Longhurst, 2007). We also added the following information on ecological, conservation, and life history for each species to enhance our understanding of potential factors that may affect their susceptibility to ingesting plastics. Specifically, we retrieved conservation information on IUCN status (IUCN, 2019) and vulnerability to overfishing (Cheung et al., 2005) for each species in our dataset. We also gathered data from FishBase (Froese & Pauly, 2019) including each species’ family and order, trophic level, habitat preference (bathydemersal, bathypelagic, benthopelagic, demersal, mesopelagic, pelagic‐oceanic, pelagic‐neritic, or reef‐associated), commercial exploitation status (highly commercial, commercial, minor commercial, subsistence, or none), aquaculture and recreational fishery status (yes or no), and the average depth found, which we computed as the average of the depth range provided by FishBase. To improve the predictive power of our analyses, we collapsed “habitat” into two broad levels standard to marine habitat classification: species living on or near the seafloor (bathydemersal, benthopelagic, demersal, and reef‐associated) were classified as “demersal,” and fishes living in the water column (bathypelagic, mesopelagic, pelagic‐oceanic, and pelagic‐neritic) were classified as “pelagic” (Day & Roff, 2000; Roff et al., 2003).
We classified foraging strategy separately for each species because the incidence of plastic ingestion may be dependent on feeding strategy (DiBeneditto & Awabdi, 2014; Peters et al., 2017). These were determined based on both the food items listed and the biological descriptions of the species on FishBase (particulate feeding, benthic foraging, filter‐feeding, grazing, scavenging, or active predation). In cases where multiple feeding strategies were described, we identified a primary foraging mode, which was based on food items that comprised the majority of the species’ diet, as well as the species’ life history. For instance, fishes were considered to exhibit particulate feeding if they primarily consumed planktonic invertebrates, euphausiids, and/or small crustaceans, even when they secondarily consumed zoobenthos. Benthic foragers fed on zoobenthos, mollusks, benthic crustaceans, echinoderms, and sea cucumbers, in addition to occasional detritus or algae. Filter‐feeders were divided into two categories: facultative and obligate. Facultative filter‐feeders often switched between particulate feeding and filter‐feeding as primary modes of foraging. Grazing and scavenging were the least frequent primary modes; the former was reported for herbivorous species that fed primarily on algae, while the latter was assigned to species that consumed solely static prey items and detritus or were listed as scavengers on FishBase (Froese & Pauly, 2019). Active predation was the strategy assigned to species whose diet items required pursuit, attack, and capture of prey (i.e., small fish, cephalopods, etc.). These were species of higher trophic position.
- Method type according to Markic et al. (2019, p. 668):
- “Method 1: visual examination of the gut content by naked eye
- Method 2: visual examination of the gut content by an optical microscope
- Method 3: chemical digestion of the gut content with subsequent filtration and microscopic analysis.”
- Polymer confirmation: the use of analytical equipment, most often Fourier‐transform infrared spectroscopy (FTIR) or Raman spectroscopy, to determine the chemical nature of recovered particles.
- Contamination control procedures, specifically:
- Use of blanks—ideally a study uses both field and laboratory blanks and describes the way the blanks were collected and accounted for in the final tallying of microplastic values.
- Clean laboratory procedures—includes a myriad of protocols aimed at reducing contamination. Several examples we noted were: cotton clothes worn, tools and instruments cleaned thoroughly before after use, and working in a fume hood or similar setting that controls airflow to the extent possible, among others.
- Size detection threshold: seawater studies have demonstrated that there is an increase in microplastics recovered as detection of smaller sizes has improved (Enders et al., 2015; Kang et al., 2015; Lindeque et al., 2020). We defined the size detection threshold as the filter mesh/pore size in all studies cases where this information was made available; however, not all studies employed filter‐based methods. Consequently, minimum detection size was not reported in studies that employed visual identification or microscope‐based methods, unless the authors deliberately excluded any debris below a designated size threshold.
2.3 Geospatial data acquisition and usage
Spatial boundaries of the Longhurst provinces were derived from a shape file downloaded from https://www.marineregions.org/ and imported into R (R Core Team, 2019) as a spatial object. For each Longhurst province, the following information was joined from our fish‐plastic dataset: FO, number of fish sampled, number of studies, number of species, and median reliability score for studies in that region. This information was then calculated for the appropriate province to generate maps corresponding to FO, number of studies, and number of fish sampled per region.
Average surface plastic density (number of items per km2) in each Longhurst region was calculated using values for the Van Sebille model of plastic abundance (van Sebille et al., 2015). These values were combined into a raster using the Raster package in R (Hijmans, 2019). The polygons defining each Longhurst province were then overlaid on the Van Sebille raster using the sf package in R (Pebesma, 2018), and the corresponding plastic density values within each province were extracted and averaged.
2.4 Statistical and modeling methods
We employed several sets of generalized linear mixed models (GLMMs) with binomial distributions where the sample size of the response variable (FO of plastic ingestion) was preserved to test hypotheses on the drivers of plastic ingestion by marine fish. We controlled for the effects of phylogeny, methodology, and publication year to maximize our ability to draw ecological, behavioral, and biogeographic inferences from the data.
We ran several GLMMs with main effects of trophic level (continuous), primary foraging strategy (factorial: particulate feeding, benthic foraging, filter‐feeding, grazing, or active predation; scavenging was omitted due to a lack of data), mean density of surface plastic pollution in the oceanographic province where the fish were sampled (continuous), and the broad regional classification of estuarine, coastal, or oceanic (factorial), and interactive effect of habitat (factorial; pelagic or demersal) and average depth (continuous). Estuarine species were included in the behavioral and ecological models (foraging strategy, average depth × habitat, and trophic level models), compared explicitly in the model that tested the effect of broad regional classification (estuarine, coastal, or oceanic), and excluded from the model that tested the effect of surface plastic pollution in the oceanographic province where the fish were sampled. We also included random effects controlling for publication year, phylogeny, and methodology.
To control for methodological differences among studies, we recorded the presence of four quality assurance criteria (polymer ID, use of blanks, clean laboratory methods, and minimum size threshold reported; recording a yes/no for each as well as a more detailed description of each study’s procedures). An overall “study reliability score” was generated with a “yes” receiving a 1 and a “no” receiving a 0 for each of those four categories, which were then summed to create a continuous scale from 0 to 4. This overall reliability score was included in our models as a random effect. We also included a random effect for method type according to Markic et al. (2019; 1, 2, or 3, factorial). Continuous main effects were scaled prior to running the models. We used the model.sel function in the MuMin package (Barton, 2019) to rank models with Akaike information criterion corrected for sample size (AICc; Hurvich & Tsai, 1989). This analysis revealed that the geographic GLMM with the predictor of plastic in the oceanographic province where the fish were sampled as the model that best predicted the observed data.
To determine whether increases in plastic ingestion were due to increased consumption or increased detection capabilities, we tested the influence of publication year and study methodology. Other studies have revealed a strong negative relationship between minimum particle size and plastic concentration in environmental samples (Enders et al., 2015; Kang et al., 2015; Lindeque et al., 2020); however, minimum particle size was reported for only half (57 of 110) of the studies we collected, and of those studies, the minimum size detected has decreased over time as laboratory methods have improved (Figure 2). Plastics detected in studies published before 2017 examined larger microplastics (>0.5 mm) compared to studies after (<0.5 mm; Figures 2b and 5a). We used this natural breakpoint in the data to assess the effect of examining for smaller particle sizes on the amount of plastic found in fish. We coded a binomial random effect for before versus after 2017 to include detectability of smaller particles as a covariate in our models.
All analyses were performed in R v. 3.6. Models were fit with the package lme4 v. 1.1.2 (Bates et al., 2014). Where applicable, findings are reported as a weighted mean ± SEM.
3 RESULTS
3.1 Overall findings
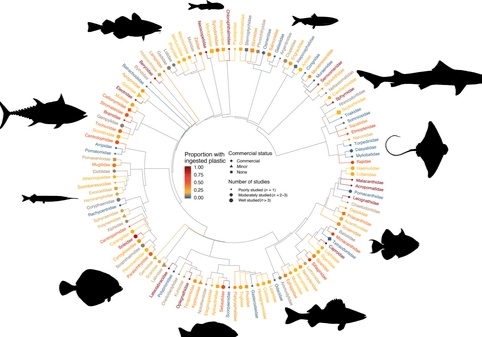
In total, we found data on plastic ingestion for 171,774 individuals of 555 species of marine and estuarine fish representing 139 families from 31 orders (Figure 1). Among these, more than two‐thirds of species had ingested plastic (386/555), while roughly one‐third had not (148/555). However, only one‐quarter of all species are well studied and commonly ingest plastic (142/555), defined here as a sample size ≥10 and a plastic FO >0.25. For each fish, the average quantity of plastic found was less than one piece per individual at the time of sampling (1.20 ± 0.08).

To obtain the most representative plastic ingestion estimates, we focused our analyses on the subset of studies that quantified micro‐ (as well as meso and macro) plastics. These 110 studies included 29,665 individuals of 508 species. Similar to the full dataset, more than two‐thirds of these species had records of plastic ingestion (360/508 = 0.70), yet plastic ingestion is more than five times as common in these studies that quantified microplastics (FO =0.26 ± 0.01) as compared to the full dataset (0.05 ± 0.01).
We sought to further control for methodology to draw inferences from aggregated data and enable cross‐study comparisons. We found that studies that chemically digested the entire gastrointestinal tract, filtered the dissolved mixture, and used microscopic identification of particles (i.e., Method 3 from Markic et al., 2019; see Section 2) reported highest plastic ingestion values (FO of 0.31 ± 0.02) in agreement with previous research (Markic et al., 2019). Further, over the years, studies more commonly reported contamination control and polymer confirmation procedures (Figure 2a), and studies that included these methods reported higher plastic FOs than those that did not (0.34 ± 0.01 vs. 0.18 ± 0.01). Plastic FO was relatively constant in studies that examined microplastics >0.2 mm, yet the incidence of plastic ingested by marine fish rose sharply as studies included particles of increasingly smaller size (Figure 2b). These discrepancies suggest that our knowledge of plastic ingestion has room for growth in terms of analytical detection limits and processing time required to isolate and quantify increasingly small debris.

3.2 Regional differences
Research on marine fish has been geographically skewed toward neritic regions (96 studies total, Figure 3; Figure S2); however, many nearshore regions are unstudied or understudied. For example, only four studies were conducted within the continental United States’ Exclusive Economic Zone, despite more marine plastic originating from the United States than any other developed nation (Jambeck et al., 2015; Law et al., 2020; Figure 2). More research is required to uncover plastic ingestion trends by marine fish in this large region. Fish in East Asian waters had the highest FO of plastic ingestion of any large marine ecosystem (FO =0.46; n = 22 studies; 3168 individuals). The seas surrounding Europe were the most well represented, both by number of studies (n = 48) and by total fish examined (n = 131,959 individuals, Figure 3; Figure S2). Conversely, studies from oceanic gyres are limited (n = 15), despite accumulations of plastic debris in the open ocean being a well‐known phenomenon (Cózar et al., 2014; Eriksen et al., 2014; Lebreton et al., 2018; Van Sebille et al., 2020).

3.3 Ecological, behavioral, and biogeographic relationships
Our modeling approach accounted for differences among phylogenetic relatedness and laboratory methodologies to identify drivers of plastic ingestion by marine fish at the global scale. Geographically, we explored two different hypotheses. First, we tested whether the incidence of plastic ingestion in marine species (i.e., estuarine studies excluded) was positively correlated to surface microplastic abundance in that Longhurst oceanographic province (Longhurst, 2007). We uncovered a strong positive relationship (z‐value: 17.17; p < 0.001). The other spatial hypothesis we tested was whether there was a difference among plastic ingestion in estuarine, coastal, or oceanic regions. We found that estuarine fish had higher levels of plastic ingestion than either coastal or oceanic fish (z‐value: −19.43; p < 0.001; z‐value: −2.02; p = 0.04; respectively). Additionally, fish in oceanic regions had a greater incidence of plastic ingestion compared to coastal regions (z‐value: 5.51; p < 0.001). Nevertheless, these patterns should be reevaluated as methods evolve and more oceanic and estuarine studies are published.
Behavioral and ecological models helped explain drivers of plastic ingestion that will aid predictions of risk for under‐ or unstudied species. Our behavioral model revealed that active predators and benthic‐foraging species ingested plastic most commonly. In particular, active predators ingested plastic more frequently than any other foraging guild (z‐value: 8.66; p < 0.001). Grazers (z‐value: −5.28; p < 0.001) and filter‐feeders (z‐value: −4.76; p < 0.001) consumed plastic least commonly. Separately, there was a positive effect of trophic level on plastic ingestion frequency (z‐value: 8.15; p < 0.001) further corroborating our aforementioned behavioral results. Overall, the likelihood of plastic ingestion decreases with depth (z‐value: −10.03; p < 0.001); however, an interactive effect between habitat and average depth was found: demersal species consume more plastic the shallower they are found (z‐value: 11.15; p < 0.001). Conversely, pelagic species showed the greatest plastic ingestion at depths of 100–200 m. Among these, hyperabundant mesopelagic lanternfishes’ (family: Myctophidae; estimated global biomass of 550–600 million tons; Catul et al., 2011) diel vertical migration combined with their frequency of plastic consumption (0.24 plastic FO; Table 1) suggests that they may drive a significant microplastic sink (108–109 particles per day) from the epipelagic to below the mixed layer in heavily polluted regions.
| Family | Species in family | FO plastic ingestion | Mean number of particles ind.−1 | Total number sampled | Total species studied | Number of studies |
|---|---|---|---|---|---|---|
| Soleidae | Soles and allies | 0.8155 | 2.102 | 699 | 4 | 5 |
| Mugilidae | Mullets and allies | 0.4781 | 2.434 | 458 | 7 | 11 |
| Myctophidae | Lanternfish | 0.2374 | 0.788 | 1984 | 36 | 10 |
| Carangidae | Jacks and allies | 0.2315 | 1.491 | 1002 | 20 | 19 |
| Pleuronectidae | Righteye flounders | 0.2069 | 0.875 | 1609 | 7 | 10 |
3.4 Conservation and commercial results
Plastic debris is one of the numerous anthropogenic stressors that imperils marine fish. While the majority of species studied (321/555) are classified as “least concern,” we identified 35 threatened, or near‐threatened, species that are well studied with records of plastic ingestion. In addition, we found 26 species that regularly ingest plastic that were also vulnerable to overfishing (vulnerability scores ≥ 50; Cheung et al., 2005). In particular, the blue shark (Prionace glauca), Atlantic bluefin tuna (Thunnus thynnus), and chinook salmon (Oncorhynchus tshawytscha) are species of high concern due to their threatened status, vulnerability to overfishing, and frequent plastic ingestion.
In addition to the overall number of species with plastic ingestion records, the number of commercially harvested species that consume plastic has increased exponentially in recent years. In our dataset, there were records of plastic ingestion in three‐quarters (210/278) of commercially fished species. Of these species, 78 were well sampled with a high incidence of plastic ingestion (Figure 4). Most of these species are also the focus of aquaculture production and recreational fisheries, and thus have the highest likelihood to be part of the supply chain (Figures 1 and 4). The common sole (Solea solea) was most worrisome in this regard with a 0.812 plastic FO (n = 642 individuals sampled across three studies) and an average of 7.17 plastic particles per individual. This species is extensively harvested in aquaculture, recreational, and commercial fisheries.

3.5 Temporal trends
As with other taxa, research on plastic ingestion by marine and estuarine fish is increasing exponentially (Figure S1a). Critically, the vast majority of studies since 2010 have documented the prevalence of microplastic debris (Figure S1). However, this increasing interest is geographically unequal; studies from coastal regions, including estuaries, are surging while investigations on open ocean fish are stagnating (Figure S1c) despite knowledge that plastic debris is rapidly accumulating in oceanic gyres (Lebreton et al., 2018).
While publication biases will likely report more frequent and intense plastic ingestion over negative results, we found evidence suggesting this problem is growing regardless. Considering all studies that recorded microplastics from 2010 to 2019, the average plastic FO in fish has doubled and continues to increase at a rate of 2.4 ± 0.4% year−1 (z‐value: 3.16; p = 0.002; Figure 5a). Our models suggest that recent studies are detecting smaller plastics, but also that fish are consuming plastic more frequently over time. Using a species accumulation curve (Figure 5b), we predict that researchers will continue to uncover an increasing number of species with records of plastic ingestion in the coming years.

4 DISCUSSION
Overall, we tallied >50 additional species with plastic ingestion than previously reported (Azevedo‐Santos et al., 2019; Markic et al., 2019). While other recent reviews provided important summaries of the pervasive issue of marine plastics in fish diets, we tested mechanistic hypotheses on the patterns and drivers of plastic consumption and quantified the pace of plastic incursion into marine food webs. To achieve this, we assessed how research methodologies have changed over time (Figure 2a), and how different methodologies affected results. This allowed us to control for relevant laboratory procedures to detect underlying trends with our modeling framework. With more comprehensive plastic consumption databases in the near future, we can continue to leverage this rapidly growing bounty of information to better understand and predict the proliferation and effects of plastic in marine food webs.
Among all marine and estuarine fish, 50 species have been extensively sampled (>500 individuals sampled), while 169 species are understudied (<10 individuals sampled). Previous work has demonstrated that a minimum of 10 individuals must be sampled to detect if a given population is ingesting plastic, and even studies with >90 fish sampled still have a 10% margin of error (Markic et al., 2019). Future research should focus attention on the aforementioned understudied and unstudied species and regions, test meaningful ecological and behavioral hypotheses, and continue to augment existing datasets for future comparative work. Standardization of laboratory procedures and reporting across studies is crucial to meet these objectives (Figure 2; Cowger et al., 2020; Provencher et al., 2017). In agreement with previous research, we found that studies that chemically digested the entire gastrointestinal tract, filtered the dissolved mixture, and used microscopic identification of particles (i.e., Method 3 from Markic et al., 2019) reported higher plastic concentrations than studies using less rigorous methods. Quality assurance metrics have become commonplace in recent years (Figure 2a), yet plastic detection methodologies could still be improved. Clean laboratory procedures including the use of blanks should be described, and the minimum size threshold of the analysis should be reported to better compare results across studies. If possible, chemically digesting and filtering the entire gastrointestinal track followed by objective identification (e.g., by FTIR or Raman spectroscopy) of at least a subset of the recovered particles is ideal. Methods of capture should be described. Of all studies we reviewed, fewer than one‐quarter (31/129) adhered to all these methodological advances. Moving forward, quality assurance metrics and Method 3 (Markic et al., 2019) should be used on at least 10 individuals per species to accurately gauge plastic consumption whenever possible.
Plastic ingestion by marine fish is widespread, but heterogenous between species, as is the case for other taxa (Savoca et al., 2016; Schuyler et al., 2014). While roughly one‐quarter of species studied ingested plastic frequently (FO > 0.25; n = 142), one‐third of all species studied (n = 148) were not found to have ingested plastic debris at all (Figure 4). For the 386 species that were found to ingest plastic, most were found with fewer than two pieces of plastic per individual at the time of capture; however, fish typically egest plastic within hours or days (Grigorakis et al., 2017; Ory et al., 2018; Xiong et al., 2019). Consequently, it is likely that plastic ingestion by marine fish is more pervasive than we could reasonably infer. It is vital that researchers continue to publish records of species without evidence of plastic ingestion to further document the spread, or reduction, of this problem.
Additionally, many groups of fish remain unexamined. Deep‐sea fish in particular are almost entirely unstudied—90% of the fish studied to date typically reside at depths between the surface and 500 m. However, research synthesized here clarifies the potential magnitude of vertical transport of plastic by mesopelagic lanternfish (family: Myctophidae, Table 1). Recent research has found high concentrations of microplastics at the interface of the epi‐ and mesopelagic (Choy et al., 2019; Pabortsava & Lampitt, 2020), and pelagic fish may also ingest plastic frequently at these depths. Given their abundance, diel vertical migrations, and the frequency with which they consume plastic, myctophids may catalyze the export of hundreds of millions to billions of microplastics from the surface to the deep ocean each day (Table 1). This hypothesis (Lusher et al., 2016) may help explain the high concentrations of microplastics found in deep‐sea ecosystems (Bergmann et al., 2017; Choy et al., 2019; Woodall et al., 2014).
Geographic analyses highlighted that coastal marine regions are the most well studied, though research from estuarine fish is on the rise (n = 19 studies; Figure S1). However, estuarine studies may be best considered separately from those on fully marine species as fish that reside in estuaries may represent different demographics of the population with different life history strategies. Additionally, a recent flurry of studies from East Asia identifies this region to be among the most polluted globally (Ding et al., 2019; Sun et al., 2019; Zhang et al., 2019; Zhu et al., 2019). Fish in neritic regions adjacent to Japan, China, the Korean Peninsula, and Southeast Asia feed two billion people; thus, additional research in the region is of utmost importance (Food & Agriculture Organization, 2018). More broadly, data are still sparse: nearly half of all marine provinces (27/56) have not been studied, including the majority of oceanic provinces (Figure 2; Figure S2). Furthermore, one‐third of provinces where this issue has been studied are only represented by only one published report (Figure S2). We uncovered no studies from the Indian, South Atlantic, or western North Pacific gyres (Figure 3; Figure S2), though there is extensive knowledge of surface debris accumulation in these regions (Cózar et al., 2014; van Sebille et al., 2015). Similarly, there was a paucity of data from high‐latitude seas (n = 2 studies, n = 228 individuals examined), and none from the Southern Ocean, even though the polar oceans are a sink for microplastic debris (Bergmann et al., 2017; Cózar et al., 2017) with new fisheries developing in these regions as ice retreats and climate changes (Food & Agriculture Organization, 2018).
Numerous species of commercial and conservation interest have been found to ingest plastic, yet the threat from ingested plastic to fish and humans is largely unknown. The innards of large fish are typically discarded prior to consumption, and thus the risk of humans ingesting plastic from fish directly is low, yet small micro‐ (<150 μm) and nanoplastics (<1 μm) can translocate from the gut to circulatory fluids, internal organs, and muscle tissue (Avio et al., 2015; Collard et al., 2017), disrupt cellular processes, and more easily transfer to predators upon consumption (Collard et al., 2017; Lu et al., 2016). This study did confirm that predatory fish were commonly found to have consumed plastic. Moving forward, monitoring top predators for plastic consumption and pollutant bioaccumulation is critical. Furthermore, their wide‐ranging movement patterns may allow mobile predators to encounter plastic in multiple source locations and, subsequently, could lead to extensive plastic redistribution across marine ecosystems.
Temporal trends in both research effort and plastic ingestion incidence suggest that the scope and severity of the problem may be underestimated. The incidence of plastic ingestion in marine fish has been growing by >2% year−1 since 2010 (Figure 5a). Our analyses suggest this is driven both by an improvement in analytical methodology (e.g., detecting smaller particles) and by fish ingesting plastic more frequently. If this trend continues unabated, the average FO of plastic in fish will be >0.50 by 2030. Furthermore, the lack of an asymptote in new species found with ingested plastic suggests that researchers have not yet fully described the role of plastics in marine food webs and ecosystems; this presages the discovery of numerous additional species with records of plastic ingestion in the coming years (Figure 5b).
As analytical capabilities improve, interest in micro‐ and nanoplastics surges, and plastic production intensifies, plastic will be found in wildlife with increasing regularity. Therefore, the numbers reported here are likely to grow as we have more studies and more sensitive techniques to better estimate rates of plastic ingestion by marine fish, and other taxa, globally. Overall, the number of marine fish species, including commercially harvested species, with records of plastic ingestion has quadrupled since the 2016 GESAMP assessment for the United Nations (GESAMP, 2016). This marked surge is likely driven by both an increase in fish‐plastic interactions and by a rapidly expanding research effort (Figure 3; Figure S1).
Fish are likely key vectors in the vertical and horizontal movement of plastic in the ocean, and may accumulate sublethal physical and chemical effects from ingested plastic (Lavers et al., 2019; Rochman et al., 2013), yet the impacts of plastic debris on marine communities and ecosystems are still mostly unknown (Bucci et al., 2020). Current evidence for humans ingesting plastic directly from fish remains scant, but there is growing concern (Barboza et al., 2018; Carbery et al., 2018; Lusher et al., 2017). For fish, plastic‐associated contaminants including phthalates, heavy metals, and persistent organic pollutants may transfer to fish tissues in addition to the delivery of such compounds through the food chain (Rochman et al., 2019). The projected increase in plastic production and disposal in the coming decades is expected to exacerbate this issue globally (Borrelle et al., 2020; Geyer et al., 2017). As humanity rapidly alters marine ecosystems (McCauley et al., 2015), quantifying the extent of plastic ingestion by marine fauna is paramount to adequately mitigate its deleterious effects moving forward. In particular, the continued aggregation and analysis of information on plastic ingestion by marine fish is vital as these data are inextricably linked to ecosystem and human health.
ACKNOWLEDGMENTS
We thank Evan Eskew for statistical consulting, Rachel Anderson for editorial assistance, Stephanie Avery‐Gomm and Danuta Wisniewska for assistance with Figure 1, and Max Czapanskiy for assistance with Figure 5b. Finally, we are thankful for the reviews from Amy Uhrin and three anonymous reviewers, whose feedback greatly improved the manuscript.
CONFLICT OF INTEREST
The authors declare no competing interests.
AUTHOR CONTRIBUTIONS
M.S.S. conceived the study. M.S.S. and A.G.M. collected and curated the data. All authors contributed to the formal analyses and visualizations. M.S.S. wrote the paper with contributions from all authors.
https://www.onlinelibrary.wiley.com/doi/full/10.1111/gcb.15533?af=R&fbclid=IwAR0wJBYWI2R8QfVEb3f3xodYpipZUdCGrwjQMys8UwYd8pCVV4pX4DdBlOs