March 2022
The global average temperature for March 2022 was about 0.4ºC higher than the 1991-2020 average for March which makes it the fifth warmest on record. Europe as a whole was about 0.4ºC cooler than average in March 2022, which is the third coldest in the last 10 years. There was a contrast in temperature anomalies across Europe, with warmer-than-average conditions in the north and colder-than-average conditions in the south; these cold conditions extended into north Africa and across into Russia.

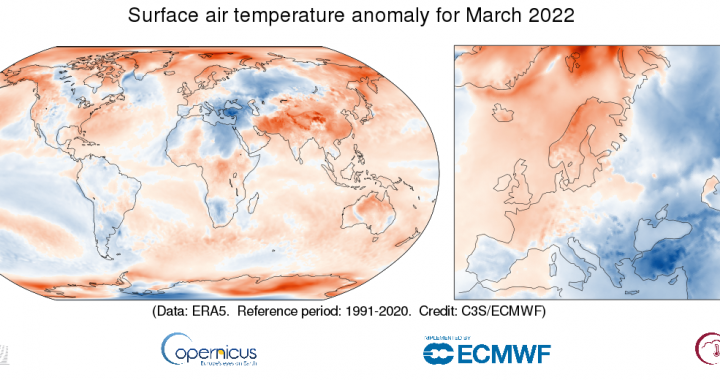
Surface air temperature anomaly for March 2022 relative to the March average for the period 1991-2020. Data source: ERA5. Credit: Copernicus Climate Change Service/ECMWF.
DOWNLOAD THE ORIGINAL IMAGE
In March 2022, there was a large range of temperature anomalies across Europe. Warmer-than-average conditions were found in northern Europe, where the warmest temperatures occurred in northern Norway. In contrast, colder-than-average conditions were experienced in southern Europe. In particular, Greece and Turkey had the coldest anomalies.
The cold anomaly in southeastern Europe extended into north Africa, across the Middle East and Caucasus, and into Russia. Colder-than-average conditions were also found in northwest and southern Africa, across a wide area of South America, in the Rocky Mountains of the United States, and in central Canada. An interesting curved line of slightly colder-than-average anomalies in western Australia related to the passage of tropical cyclone Anika.
Higher than usual temperatures occurred in a region from Iran across India and into China. Notably, India had its warmest March in records which stretch back 122 years. Warmer-than-average conditions were also seen in northeastern Russia, eastern Antarctica, the Arctic, northern Australia, central Africa, along the Pacific coast of North America, and in the eastern United States.
Air temperatures varied over the Atlantic Ocean, apart from a warmer-than-average region off the eastern United States and a colder-than-average area in the Labrador Sea and to the south of Greenland. Conditions were mixed across the Pacific Ocean, with above-average temperatures mostly over the mid-latitude North and South Pacific. Warmer-than-average sea surface temperatures to the east of Australia also caused a bleaching event in the Great Barrier Reef. Below-average temperatures occurred along the coast of western North America and to the west of South America. Tropical and sub-tropical regions over the eastern Pacific were also colder than average, which related to the continuing La Niña conditions. There was a mixture of warm and cold anomalies over the Indian Ocean and Southern Ocean.

Monthly global-mean and European-mean surface air temperature anomalies relative to 1991-2020, from March 1979 to March 2022. The darker coloured bars denote the March values. Data source: ERA5. Credit: Copernicus Climate Change Service/ECMWF.
ACCESS TO DATA | DOWNLOAD THE ORIGINAL IMAGE
Globally, March 2022 was:
-
0.39°C warmer than the 1991-2020 average for March
-
the fifth warmest March on record
-
close to 0.2°C cooler than the warmest March, which was in 2016
European-average temperature anomalies are generally larger and more variable than global anomalies. The European-average temperature for March 2022 was 0.43°C lower than the 1991-2020 average. The month was the third coldest March in the last 10 years, but it was much less extreme – around 2.4°C warmer – than the -2.71°C anomaly in March 2013.
Temperatures in the Polar regions  Monthly Arctic-mean* surface air temperature anomalies from 1979 to 2022, relative to 1991-2020. Data source: ERA5. Credit: Copernicus Climate Change Service/ECMWF.
ACCESS TO DATA | DOWNLOAD THE ORIGINAL IMAGE
The Arctic experienced warmer-than-average temperatures in March, with the largest positive anomalies found in the eastern Atlantic sector from Svalbard to Novaya Zemlya. Across the Arctic, the temperature was 2.09°C above the 1991-2020 average, which made it the fourth warmest on record and about 0.5°C cooler than the warmest March in 2017. The Antarctic also saw an intense warm spell, with air temperatures well above average, and in Vostok, for example, the temperature reached -17.7° C which is the warmest March temperature measured there in its 65-year recorded history.
To read more about long-term temperature change in the Arctic, see the Arctic tab in the “Temperature indicator”.
*The Arctic temperature time-series is defined over all surface for the region 66-90°N, 0-360°E.
The last 12 months – April 2021 to March 2022

Surface air temperature anomaly for April 2021 to March 2022 relative to the average for 1991-2020. Data source: ERA5. Credit: Copernicus Climate Change Service/ECMWF.
DOWNLOAD THE ORIGINAL IMAGE
Temperatures averaged over the last twelve-month period were:
-
above average over most land areas and the majority of the ocean surface
-
markedly above the 1991-2020 average in a region stretching from northern Arabia to Siberia, and over central North America, north-western and central Africa, southern South America, East Antarctica and the Weddell Sea
-
close to average over much of Europe, but above average in the east, and to a lesser extent over a band eastward from Ireland to southern Scandinavia
-
below average over some land areas, including parts of northern Canada and Alaska, easternmost Russia, north-eastern South America, southern Africa, India, Australia, and Antarctica
-
below average over the eastern equatorial Pacific, where the La Niña event that peaked in late 2020 reintensified later in 2021 and continued into 2022
-
also below average over the Chukchi Sea, parts of the eastern North Pacific and several oceanic areas in the southern hemisphere.

Running twelve-month averages of global-mean and European-mean surface air temperature anomalies relative to 1991-2020, based on monthly values from March 1979 to March 2022. The darker coloured bars are the averages for each of the calendar years from 1979 to 2020. Data source: ERA5. Credit: Copernicus Climate Change Service/ECMWF.
ACCESS TO DATA | DOWNLOAD THE ORIGINAL IMAGE
Averaging over twelve-month periods smooths out shorter-term variations in regional- and global-average temperatures. Globally, the last twelve months were 0.31°C warmer than the 1991-2020 average. This twelve-month average anomaly is well below the 0.46°C average for the twelve-month periods ending in September 2016 and May and June 2020, the three warmest periods in this data record. The warmest calendar year is 2016, with a temperature 0.44°C above the 1991-2020 average. 2020 was on a par with 2016, being cooler by less than 0.01°C, well below the spread among multiple datasets. The third, respectively fourth warmest calendar year are 2019 and 2017, their temperatures were 0.40°C and 0.34°C above average. 2021 was the fifth warmest on record, but only marginally warmer than the years 2015 and 2018.
The average global temperature for the twelve months to March 2022 is between 1.1 and 1.2°C above the 1850-1900 level. The way the average for the 1991-2020 reference period is related to that for 1850-1900 is outlined in the sidebar.
There is more variability in average European temperatures, but values are more certain due to the relatively dense observational coverage of the continent. The average for this twelve-month period is 0.38°C above the 1991-2020 average. 2020 is the warmest calendar year on record for Europe by a clear margin, with a temperature 1.2°C above the 1991-2020 average.
Note on global values from ERA5 and other temperature datasets
The spread in global averages from various temperature datasets has been reported previously to have been relatively large over recent years. An updated version of the dataset principally responsible for this spread was released in mid-December 2020. This version agrees much better with other datasets for the latest few years. This version does however show a larger warming since 1850-1900 than its predecessor, which has an influence on the ‘pre-industrial’ estimate as mentioned above. Read more in the Temperature indicator.
There is general agreement among datasets that the period from 2015 to 2020 is much warmer globally than any previous such period. There is also agreement that the global temperature has risen at an average rate close to 0.2°C per decade since the late 1970s. There is nevertheless still some spread between the datasets for recent years, such as for 2020, and the annual average temperature anomalies for these years from ERA5 are generally higher than those from the five other datasets considered. The differences range from 0.02 to 0.08°C for 2016-2020. The range is 0.00 to 0.07°C if air temperature over sea is replaced by sea-surface temperature for ERA5 and the other dataset for which sea-surface temperature was not used by design. The remaining differences depend partly on the extent to which datasets represent the relatively warm conditions that have predominated over the Arctic and Antarctic during these years. Differences elsewhere in estimates of sea-surface temperature and surface air temperature over land have been further factors.
The average surface air temperature analysis homepage explains more about the production and reliability of the values presented here, but has yet to be updated to include the new information on dataset spread mentioned above.
Fuente: https://climate.copernicus.eu/surface-air-temperature-march-2022